Chronic Kidney Disease Progression Prediction
Patient Input Interface
Introduction:
This page showcases the user interface of the deep learning-based CKD progression prediction system. It demonstrates how clinicians can input specific patient data, including:
- Demographics: Age and Sex.
- Clinical Measurements: BMI, Waist-to-Hip Ratio, and Blood Pressure (Systolic/Diastolic).
- Laboratory Results: HbA1c, Fasting Glucose, Lipid profile (LDL-C, HDL-C, Total Cholesterol), Serum Potassium, and Creatinine.
- Lifestyle & Medical History: Smoking status, and history of stroke, foot problems, or eye problems.
- Medications: Use of Insulin, Antihypertensives, Angiotensin inhibitors, and other antidiabetic drugs.
The system allows for a "Full" or "Partial" model type and offers prediction horizons of 2 or 5 years.
Model Outputs and Survival Curve
Introduction:
This tool illustrates the primary outputs generated by the model. It provides a specific "Predicted risk (%)"—in this example, 1.50%—and classifies the patient into a "Risk group" based on their percentile (e.g., Moderate-risk).
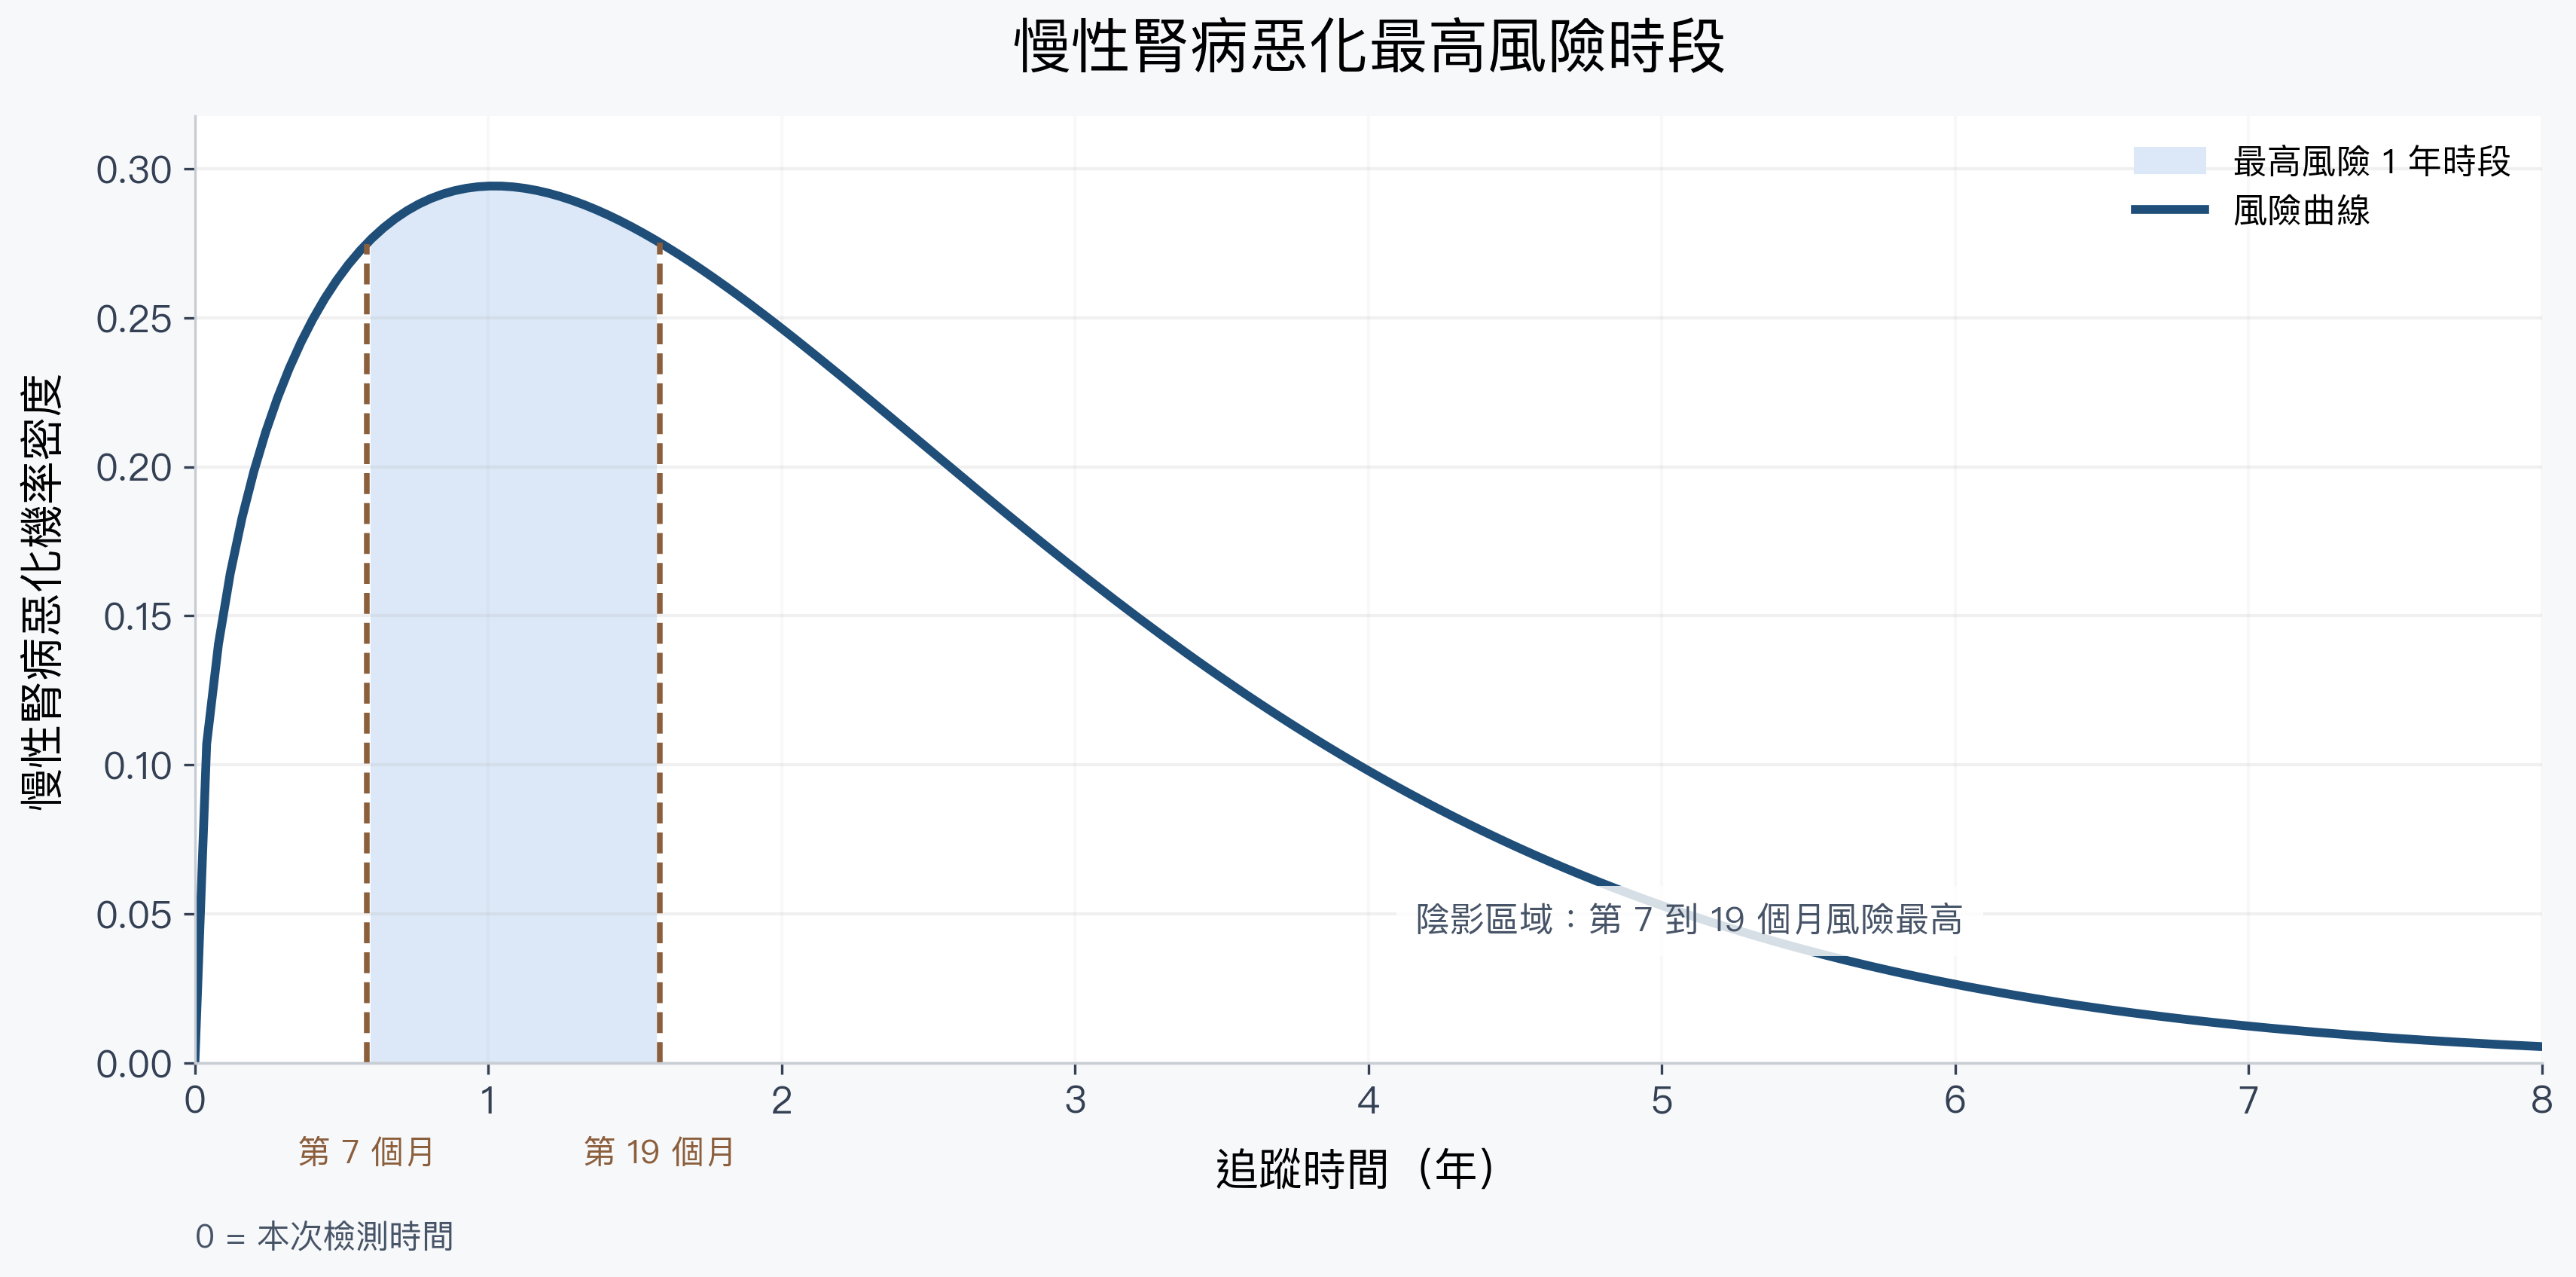
A key visual element is the Illustrative Survival Curve, which plots the estimated survival probability (the probability of remaining free from CKD progression) over the selected 5-year time horizon. The curve shows a gradual decline, allowing for continuous-time risk estimation.
Population Risk Distribution and Clinical Interpretation
Introduction:
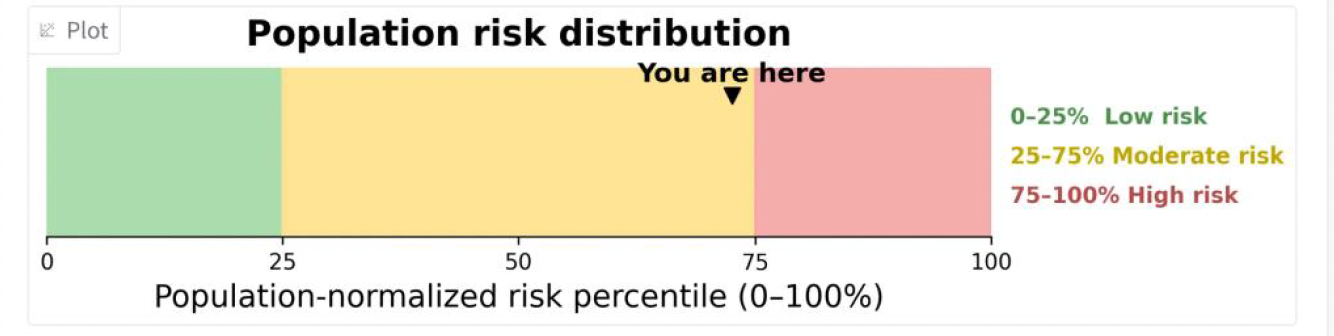
The tool provides context for the individual risk by placing it within a "Population risk distribution." It uses a percentile-based scale to categorize risk into three tiers:
- Low risk (0-25%)
- Moderate risk (25-75%)
- High risk (75-100%)
Recommended Clinical Considerations is tailored to the risk group. For a moderate-risk patient, this includes more structured monitoring of renal function every 3–6 months, reviewing glycemic and blood pressure control, and considering the optimization of reno-protective therapies.